Dialogue Insights - Historic Reporting Agent Performance
Introduced in DC2025.02a - Arnhem
The agent overview report gives you an overview of all agents filtered per contact center.
Note
The report and its dataset gets refreshed every day at 00:30 of the timezone where your Fabric workspace resides.
(Any report open in your browser while the underlying dataset has refreshed, must be manually refreshed in the app for the new dataset to become visible).
The three possible regions where Fabric workspaces reside (defined by UCC A Unified Contact Center, or UCC, is a queue of interactions (voice, email, IM, etc.) that are handled by Agents. Each UCC has its own settings, IVR menus and Agents. Agents can belong to one or several UCCs and can have multiple skills (competencies). A UCC can be visualized as a contact center “micro service”. Customers can utilize one UCC (e.g. a global helpdesk), a few UCC’s (e.g. for each department or regional office) or hundreds of UCC’s (e.g. for each bed at a hospital). They are interconnected and can all be managed from one central location. Service deployment in Dialogue Cloud) are:
-
EMEA-GWC: W. Europe Standard Time
-
APAC-SEA: Singapore Standard Time
-
NORA-CUS: Central America Standard Time
The mapping of which Fabric workspace region is used by which UCC Service region is provided in table below
| If UCC Service region is: | Then Fabric workspace region is: |
|---|---|
| EMEA-WEU (West Europe) | EMEA-GWC - Germany West Central |
| EMEA-GWC (Germany West Central) | EMEA-GWC - Germany West Central |
| NORA-CUS (Central US) | NORA-CUS - Central US |
| APAC-SEA (South East Asia) | APAC-SEA - South East Asia |
| APAC-AUE (Australia East) | APAC-SEA - South East Asia |

The following components can be found on the dashboard:
-
Filters
-
Navigation
-
Cards
-
Table Settings
Table
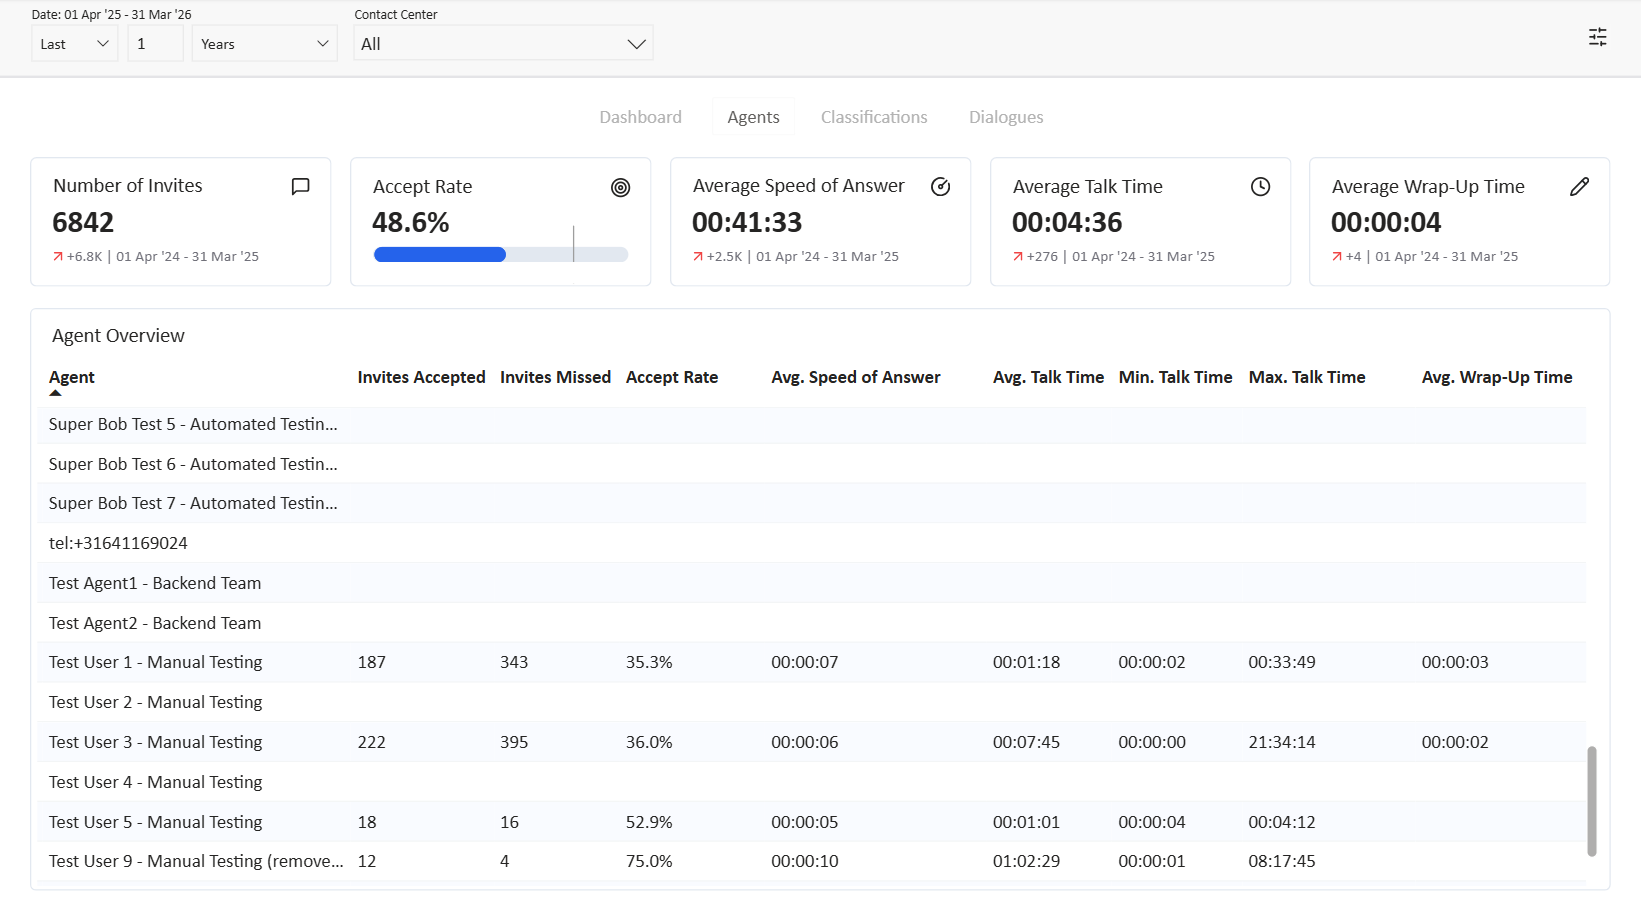
The agent overview report contains a table with all agents that were assigned to the selected contact centers in the time period that is set in the filter.
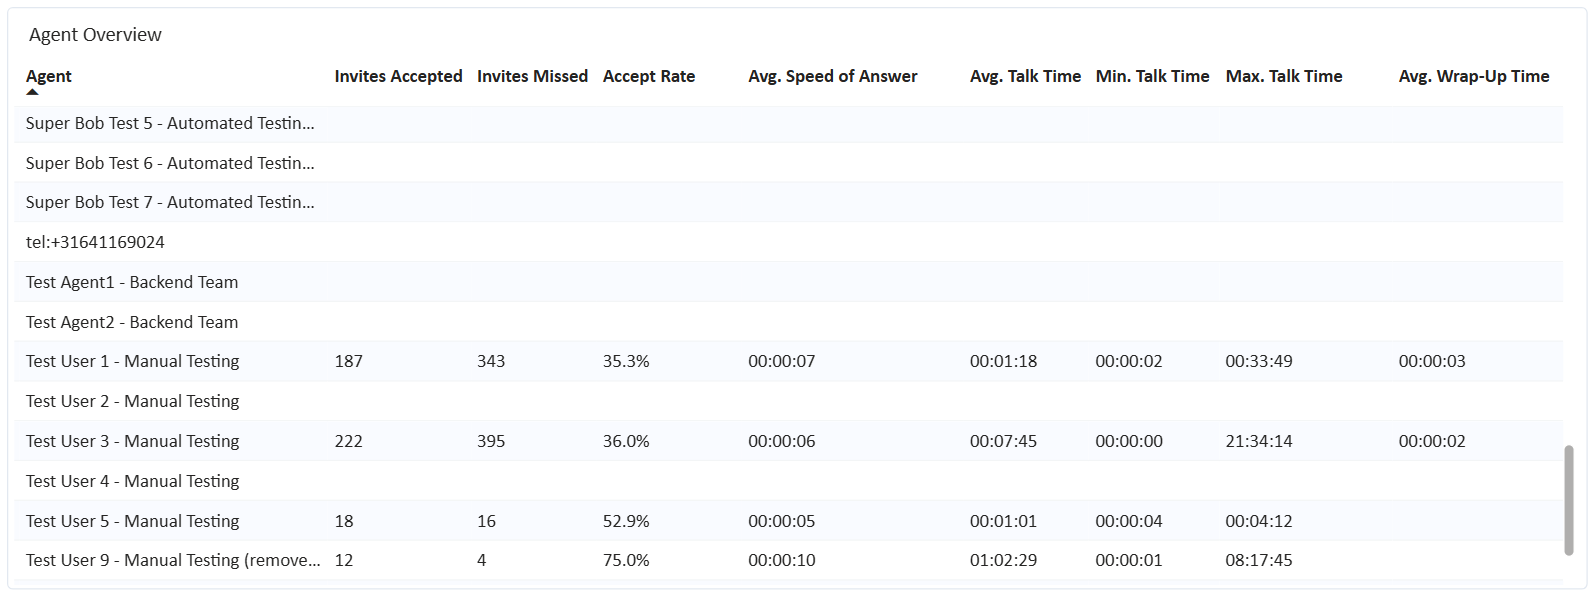
Agent Overview
For each Agent the following details are displayed:
-
Agent: the display name of the agent
-
Invites accepted: the number of invites accepted by this agent in the selected period and contact center.
-
Invites missed: the number of invites missed by this agent in the selected period and contact center.
-
Accept rate: the rate between the number of accepted invites and the total number of invites for this agent in the selected period and contact center.
-
Average speed of answer: the average time it took this agent to answer the accepted invites for the selected period and contact center.
-
Average talk time: the average time this agent was connected to the dialogues it accepted within the selected period and contact center.
-
Minimal talk time: the minimal time this agent was connected to a dialogue it accepted within the selected period and contact center.
-
Maximum talk time: the maximum time this agent was connected to a dialogue it accepted within the selected period and contact center.
-
Average wrap-up time: the average time this agent spent in wrap-up time after it disconnected from dialogues within the selected period and contact center.