Dialogue Insights - Historic Reporting Dashboard
Introduced in DC2025.02a - Arnhem
The historical dashboard gives you high-over insights in the contact center performance over the past days, months or years.
Note
The report and its dataset gets refreshed every day at 00:30 of the timezone where your Fabric workspace resides.
(Any report open in your browser while the underlying dataset has refreshed, must be manually refreshed in the app for the new dataset to become visible).
The three possible regions where Fabric workspaces reside (defined by UCC A Unified Contact Center, or UCC, is a queue of interactions (voice, email, IM, etc.) that are handled by Agents. Each UCC has its own settings, IVR menus and Agents. Agents can belong to one or several UCCs and can have multiple skills (competencies). A UCC can be visualized as a contact center “micro service”. Customers can utilize one UCC (e.g. a global helpdesk), a few UCC’s (e.g. for each department or regional office) or hundreds of UCC’s (e.g. for each bed at a hospital). They are interconnected and can all be managed from one central location. Service deployment in Dialogue Cloud) are:
-
EMEA-GWC: W. Europe Standard Time
-
APAC-SEA: Singapore Standard Time
-
NORA-CUS: Central America Standard Time
The mapping of which Fabric workspace region is used by which UCC Service region is provided in table below
| If UCC Service region is: | Then Fabric workspace region is: |
|---|---|
| EMEA-WEU (West Europe) | EMEA-GWC - Germany West Central |
| EMEA-GWC (Germany West Central) | EMEA-GWC - Germany West Central |
| NORA-CUS (Central US) | NORA-CUS - Central US |
| APAC-SEA (South East Asia) | APAC-SEA - South East Asia |
| APAC-AUE (Australia East) | APAC-SEA - South East Asia |

This report includes:
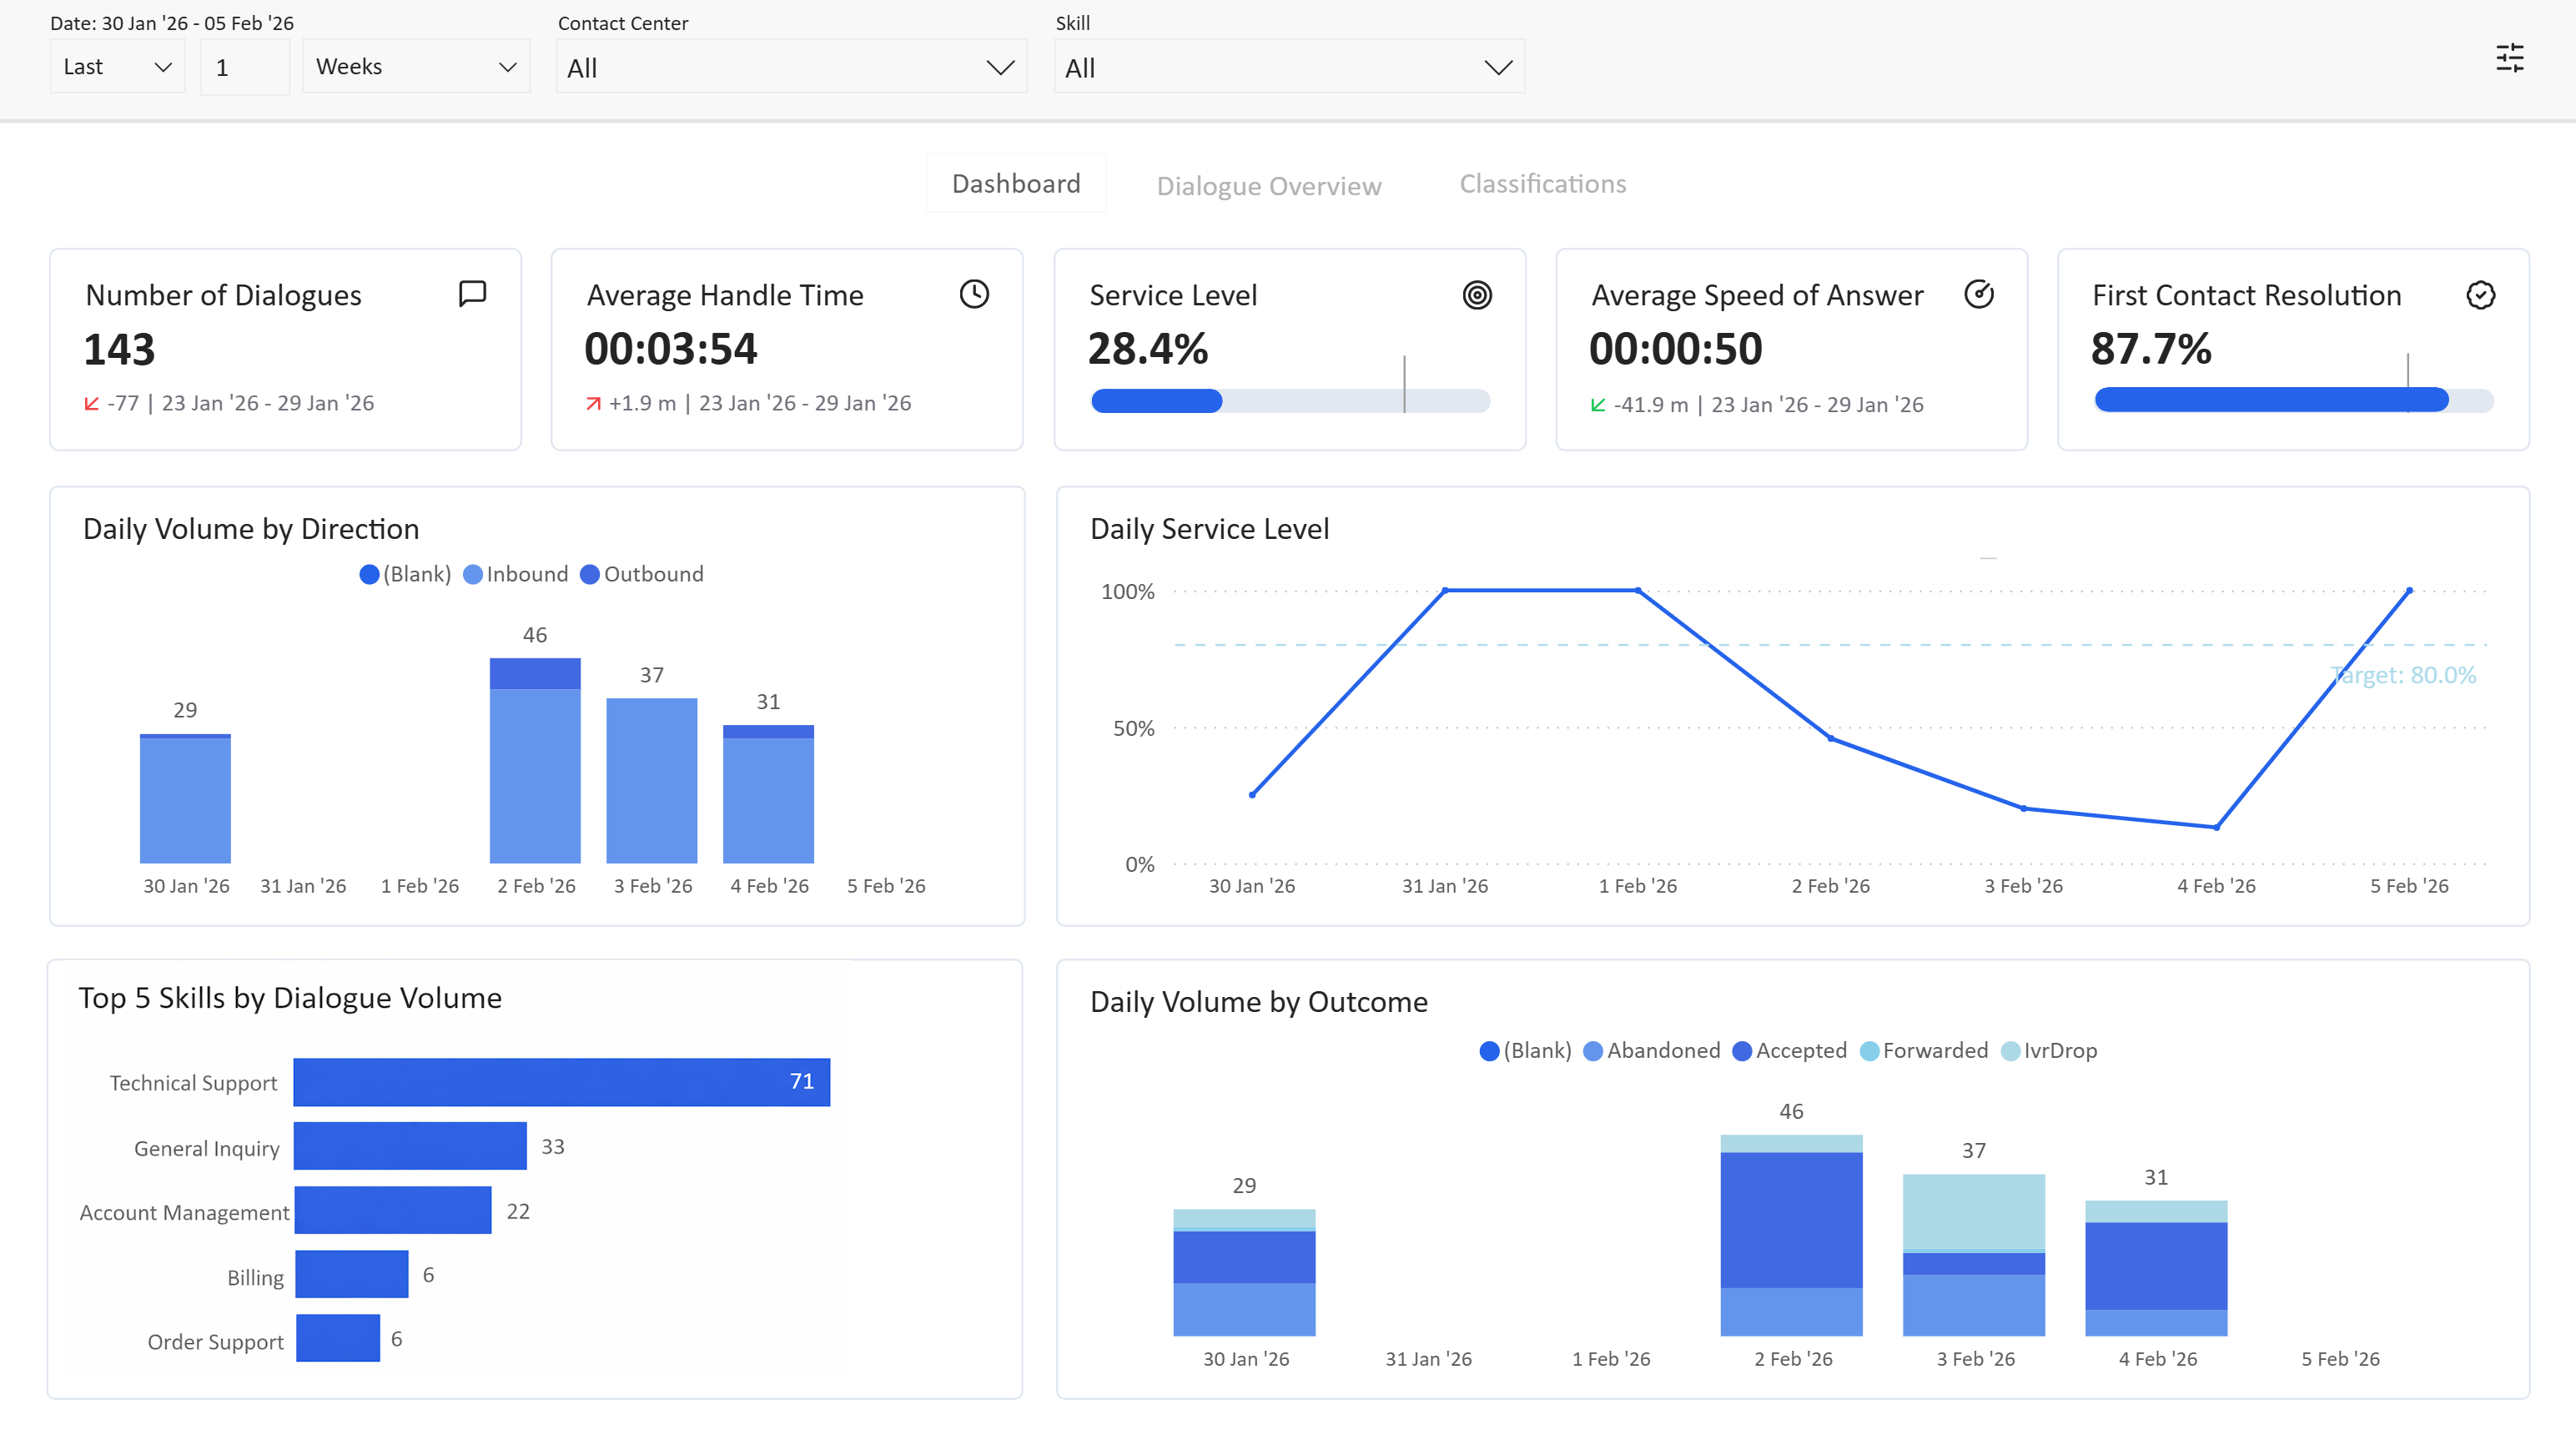
Filters
Filters allow you to refine the data displayed on the dashboard by selecting a specific time range, contact centers and/or skills.

Time Range
The Time Range filter allows you to filter dashboard data on a dynamic date range relative to the current date, such as "Last 30 days" or "This month". By using a relative date filter, data is automatically matched to the selected time interval when the report is refreshed, keeping the date range relevant without manual adjustments.
To apply this filter:
-
First, select the time direction:
Choose last, next, or this.
-
Next, enter the number:
Specify the quantity of time units you wish to include.
-
Finally, select the time unit:
Choose from the following options:
- days
- weeks; starting today +/- 6 days
- weeks (calendar); starting first day of the week
- months; starting today +/- 30 days
- months (calendar); starting first day of the month
- years; starting today +/- 365 days
- years (calendar); starting first day of the month
Any changes you make are applied immediately, and the report updates accordingly.
Contact Center
The Contact Center filter enables you to filter data for one or more specific contact centers, or for all contact centers. When you click the filter, a dropdown menu opens with a search bar to help you quickly locate the desired contact center. From this menu, you can:
-
Select a specific contact center by clicking the corresponding item in the dropdown.
-
Select multiple contact centers by holding the Ctrl (Windows/Linux) or Cmd (macOS) while clicking each item.
-
Select all contact centers by choosing the "All <entity name>" option.
Skill
The Skill filter operates in the same way as the Contact Center filter. It provides a more granular level of control, allowing you to filter and visualize data at the skill level within the real-time dashboard.
Search criteria
Please note: the search criteria matches parts of words and is case-insensitive (this is different compared to the real-time dashboard).
Menu
The menu can be used to navigate between the different reports that are available today.

Cards
Cards present key metrics about your contact center’s performance in a clear, numerical format.
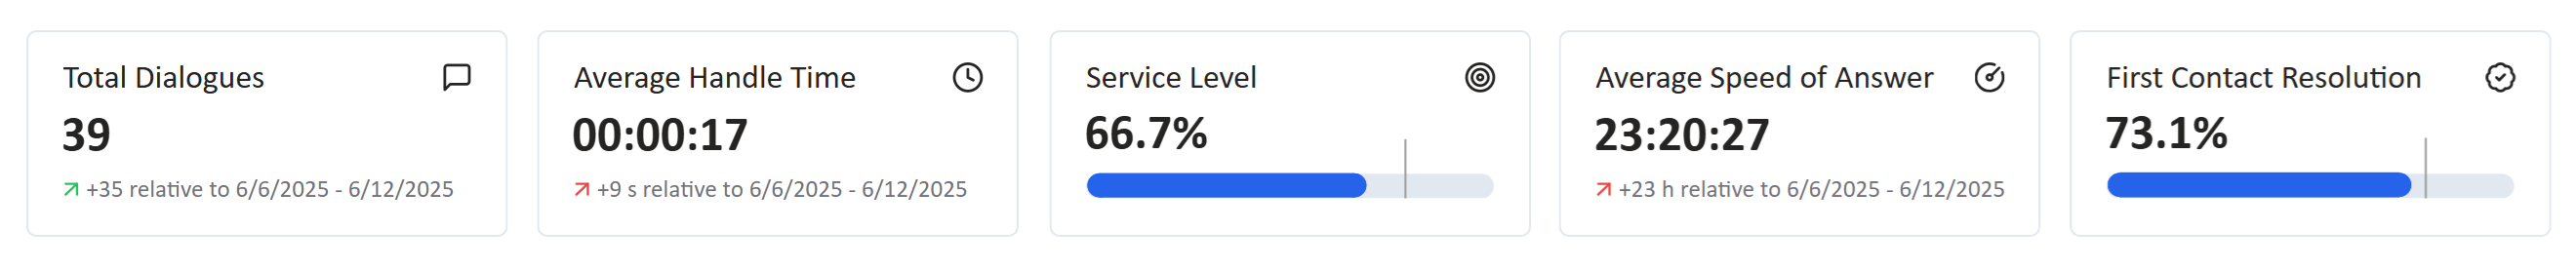
Total Dialogues
The Total Dialogues card displays the total number of dialogues for the selected period, contact centers, and skills. This includes both inbound dialogues (including dialogues dropped while in the IVR Interactive Voice Response, or IVR, is a telephone application to take orders via telephone keypad or voice through a computer. By choosing menu options the caller receives information, without the intervention of a human operator, or will be forwarded to the appropriate Agent.) as well as outbound dialogues. The card also indicates whether the current period’s dialogue volume has increased (↗ positive), decreased (↙ negative), or stayed the same (= neutral) compared to the previous period.
Large differences between periods are shown in a shortened format for readability:
-
1,250 becomes 1.3K
-
1,250,000 becomes 1.3M
-
1,250,000,000 becomes 1.3B
The previous period is determined by the selected time range. If the previous period is a:
-
Whole month: Previous whole month
-
Whole year: Previous whole year
-
Otherwise: The exact same number of days immediately prior to the selected period
Average Handle Time
The Average Handle Time card shows the average duration of dialogues for the selected period, contact centers, and skills. Handle time is measured from the moment an agent accepts a dialogue until it is completed or disconnected, including hold times and transfers. The card also indicates whether the average handle time has increased (↗ negative), decreased (↙ positive), or stayed the same (= neutral) compared to the previous period, displayed in whole seconds, minutes, or hours.
Service Level
The Service Level card presents the service level for the selected period, contact centers, and skills. This metric is calculated as the number of inbound dialogues that were queued and answered within 20 seconds, divided by the total number of inbound dialogues that were queued. Furthermore it shows a target (represented by a vertical line) to quickly assess how far the metric is from its target value.
Currently, the 20-second threshold is fixed, but in the future, it will be configurable or inherited from the UCC settings.
The default target value is 80% and can be updated in the Settings.
Average Speed of Answer
The Average Speed of Answer card displays the average time it takes agents from the selected contact centers and skills to answer inbound dialogues that were queued during the selected period. The card also indicates whether the average speed of answer has increased (↗ negative), decreased (↙ positive), or stayed the same (= neutral) compared to the previous period, shown in whole seconds, minutes, or hours.
First Contact Resolution
The First Contact Resolution card shows the percentage of inbound audio dialogues that were queued, answered, and handled by the initial agent (i.e. the answered inbound audio dialogues which were not transferred) compared to the total number of inbound audio dialogues which were answered. Furthermore it shows a target (represented by a vertical line) to quickly assess how far the metric is from its target value.
The default value for the target is 80% and can be updated via the Settings.
Graphs
The dashboard also contains a series of graphs that deliver valuable insights.
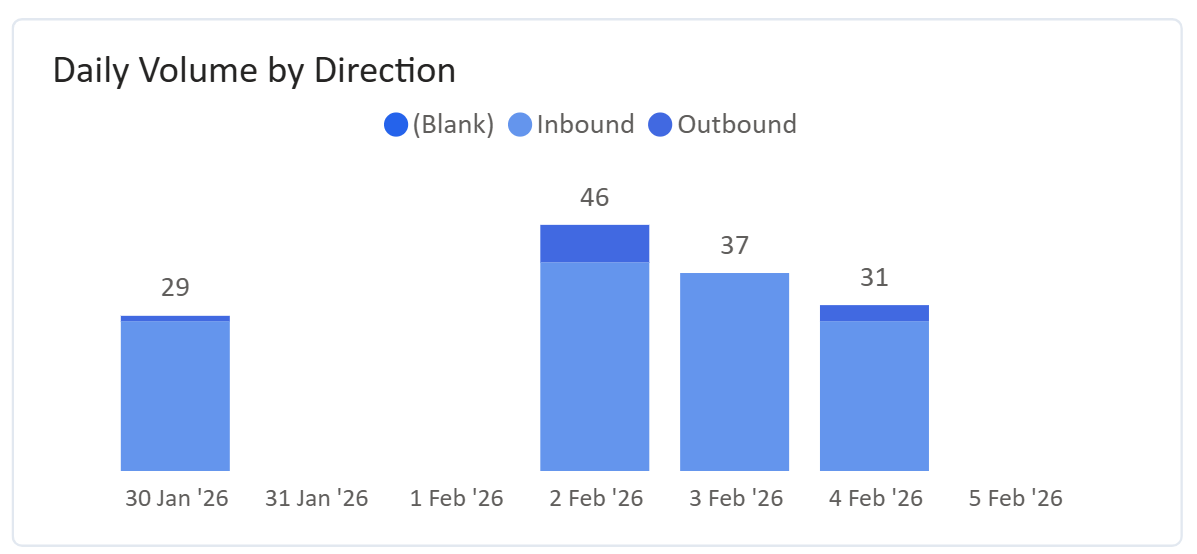
Daily Dialogue Volume by Direction
The Daily Dialogue Volume by Direction graph displays the total number of dialogues each day, distinguishing between inbound and outbound dialogues. This visualization enables you to quickly assess daily activity levels and understand directional trends over time.
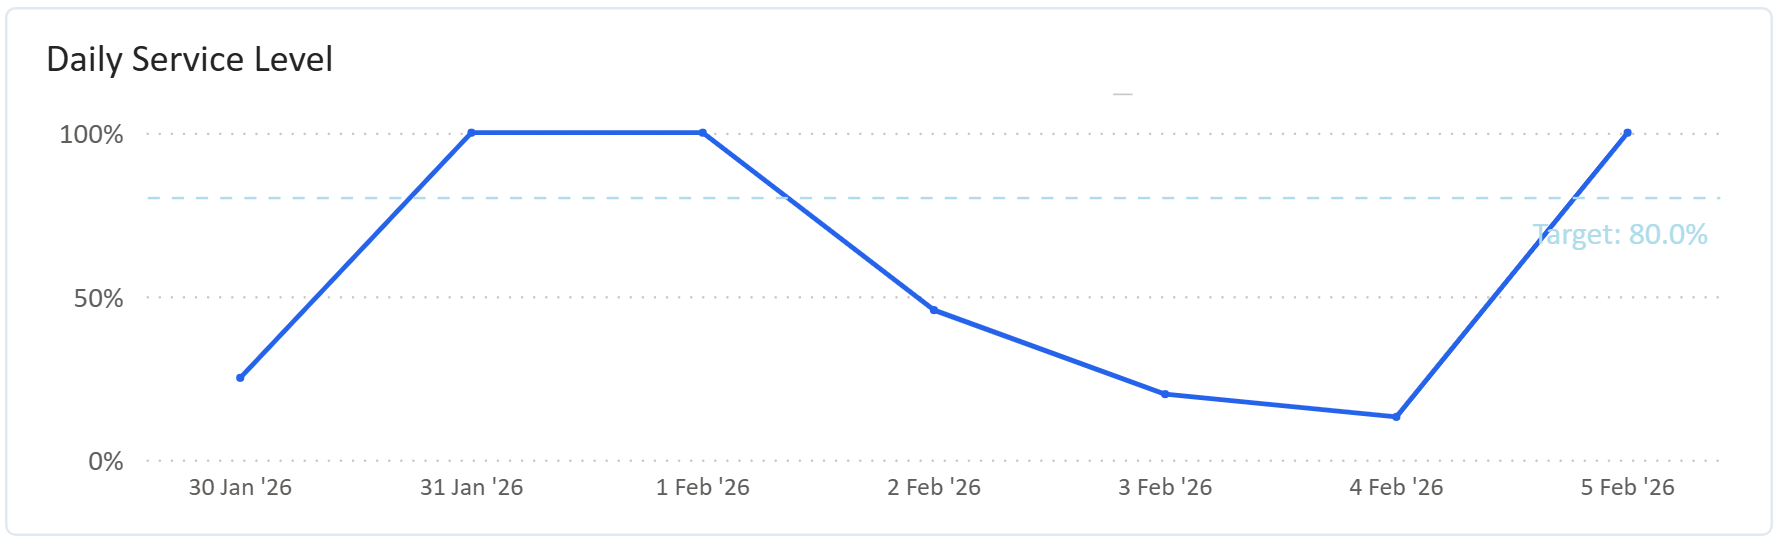
Daily Service Level
The Daily Service Level graph tracks the service level achieved each day. Like the SLA card, it uses a fixed threshold of 20 seconds to determine if a dialogue was answered within SLA. The graph also highlights the default target value of 80%, which can be adjusted in the Settings to reflect evolving business goals.
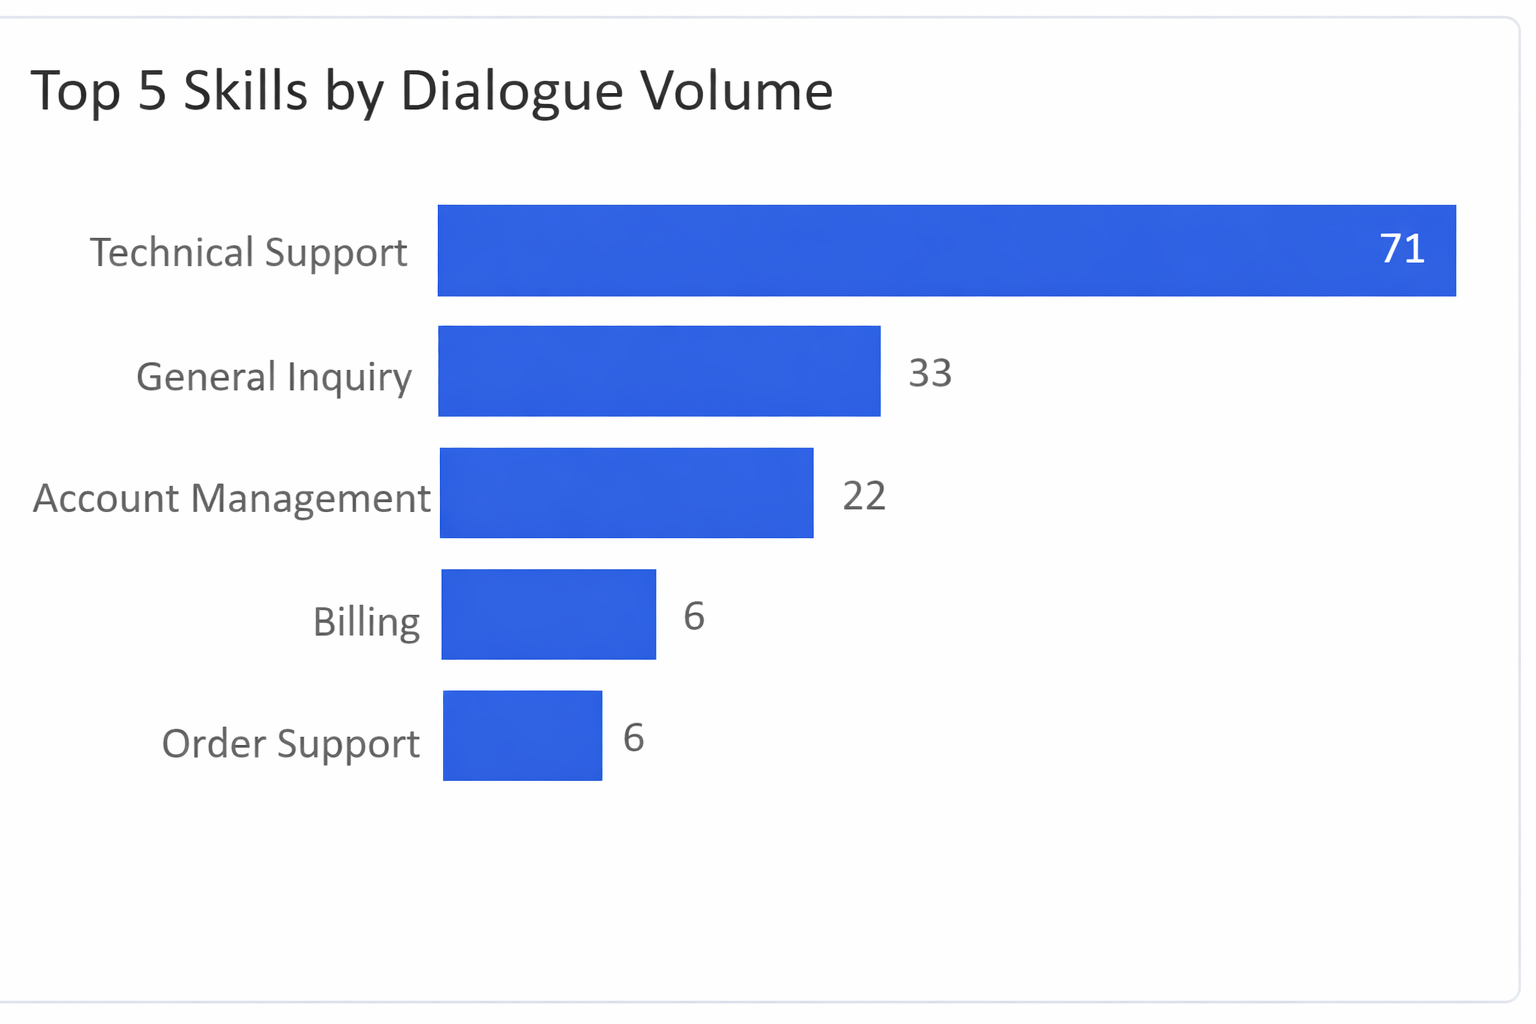
Top 5 Skills by Dialogue Volume
The Top 5 Skills by Dialogue Volume graph illustrates the number of dialogues per day, categorized by skill. This view allows you to monitor workload distribution and skill utilization.
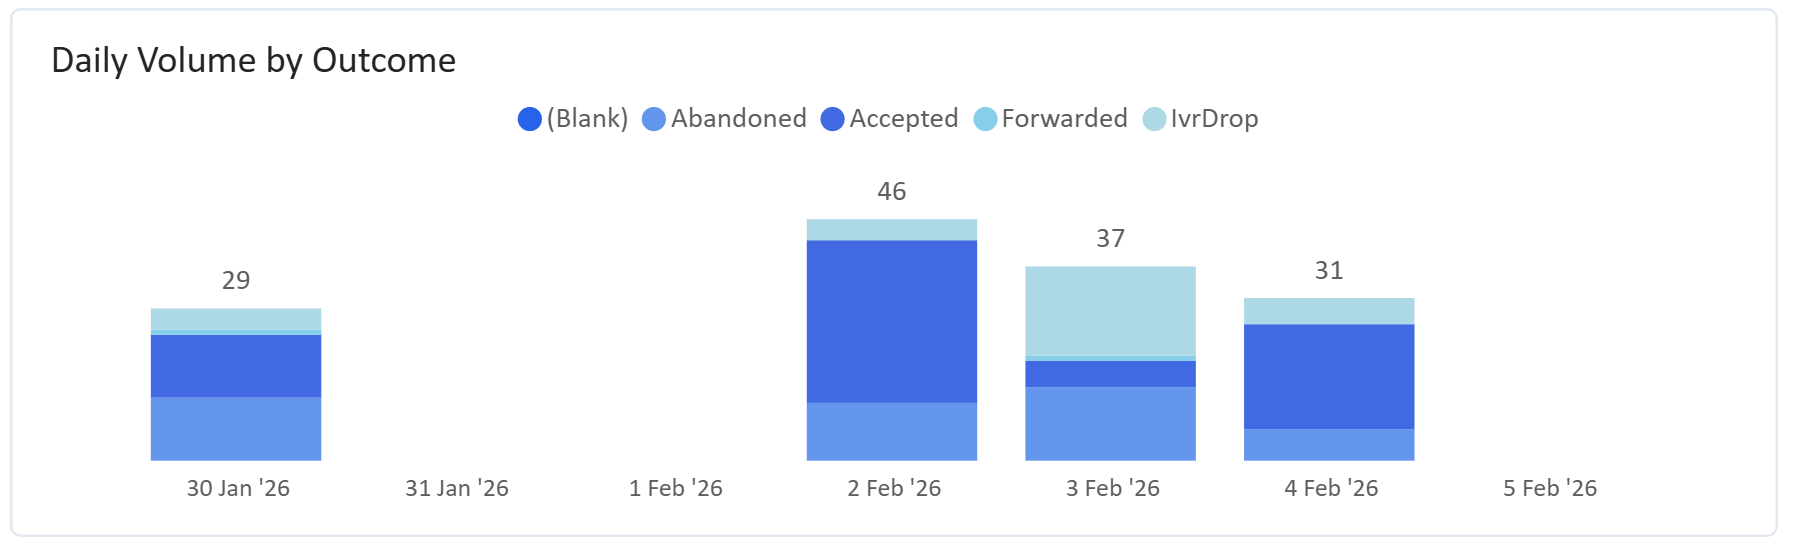
Daily Volume by Outcome
The Daily Volume by Outcome graph breaks down the number of dialogues per day according to their final status: Abandoned, Accepted, Forwarded, or IVR Drop.
Settings
The historical report includes several settings that can be managed via the settings menu.
To open the settings menu, click the settings icon.
![]()
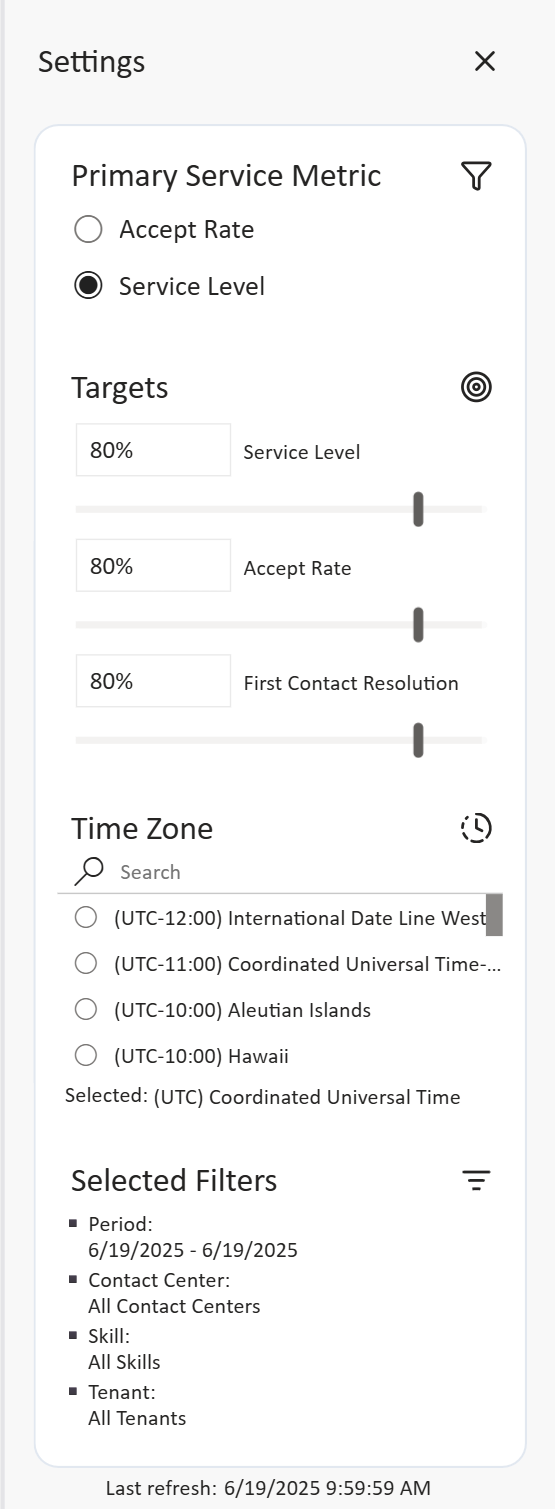
Primary Service Metric
The Primary Service Metric setting allows you to toggle between displaying the Service Level and the Accept Rate as the primary metric. When "Accept Rate" is selected, the Service Level card will display the Accept Rate instead, and vice versa. This feature was introduced in response to a growing trend where more customers prioritize the Accept Rate over the Service Level.
Targets
The Targets setting enables you to adjust the target bar for the Service Level, Accept Rate, and First Contact Resolution cards. This helps you quickly assess how far each metric is from its target value.
Time Zone
The Time Zone setting lets you change the time zone in which data is displayed on the real-time dashboard. This setting is used to determine the start of the day and updates all metrics accordingly, furthermore this setting is used for the "Dialogue Volume (per hour)" graph, ensuring that the data is displayed on the correct hour of the local time zone. The currently selected time zone is displayed below the setting.
Selected Filters
The Selected Filters section shows the filters currently applied to the real-time dashboard. It displays the selected period (default: today), as well as the contact centers, skills, and tenants for which the data is being filtered.