Dialogue Insights - Historic Reporting Dialogue Classifications
Introduced in DC2025.02a - Arnhem
The Dialogue Classifications report shows how agents classify dialogues and how classification trends change over time.
Note
The report and its dataset gets refreshed every day at 00:30 of the timezone where your Fabric workspace resides.
(Any report open in your browser while the underlying dataset has refreshed, must be manually refreshed in the app for the new dataset to become visible).
The three possible regions where Fabric workspaces reside (defined by UCC A Unified Contact Center, or UCC, is a queue of interactions (voice, email, IM, etc.) that are handled by Agents. Each UCC has its own settings, IVR menus and Agents. Agents can belong to one or several UCCs and can have multiple skills (competencies). A UCC can be visualized as a contact center “micro service”. Customers can utilize one UCC (e.g. a global helpdesk), a few UCC’s (e.g. for each department or regional office) or hundreds of UCC’s (e.g. for each bed at a hospital). They are interconnected and can all be managed from one central location. Service deployment in Dialogue Cloud) are:
-
EMEA-GWC: W. Europe Standard Time
-
APAC-SEA: Singapore Standard Time
-
NORA-CUS: Central America Standard Time
The mapping of which Fabric workspace region is used by which UCC Service region is provided in table below
| If UCC Service region is: | Then Fabric workspace region is: |
|---|---|
| EMEA-WEU (West Europe) | EMEA-GWC - Germany West Central |
| EMEA-GWC (Germany West Central) | EMEA-GWC - Germany West Central |
| NORA-CUS (Central US) | NORA-CUS - Central US |
| APAC-SEA (South East Asia) | APAC-SEA - South East Asia |
| APAC-AUE (Australia East) | APAC-SEA - South East Asia |

This report includes:
Cards
Cards present key metrics about dialogue classifications.
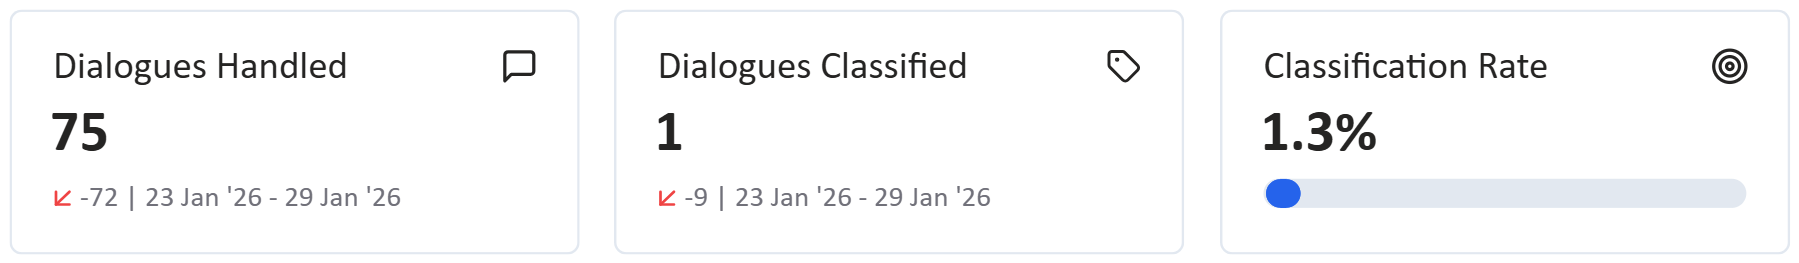
Dialogues Handled
The Dialogues Handled card displays the number of dialogues that are handled by an Agent for the selected period, contact centers, and skills. This includes both inbound dialogues as well as outbound dialogues. The card also indicates whether the current period’s dialogue volume has increased (↗ positive), decreased (↙ negative), or stayed the same (= neutral) compared to the previous period.
Large differences between periods are shown in a shortened format for readability:
-
1,250 becomes 1.3K
-
1,250,000 becomes 1.3M
-
1,250,000,000 becomes 1.3B
The previous period is determined by the selected time range. If the previous period is a:
-
Whole month: Previous whole month
-
Whole year: Previous whole year
-
Otherwise: The exact same number of days immediately prior to the selected period
Dialogues Classified
The Dialogues Classified card shows the number of dialogues that are classified by an Agent for the selected period, contact centers, and skills. The card also indicates whether the number of classified dialogues increased (↗ positive), decreased (↙ negative), or stayed the same (= neutral) compared to the previous period.
Classification Rate
The Classification Rate card shows the percentage of dialogues that are classified by an Agent compared to the total number of dialogues that are handled by an Agent for the selected period, contact centers, and skills.
Graphs
The classification report also contains a series of graphs that deliver valuable insights.
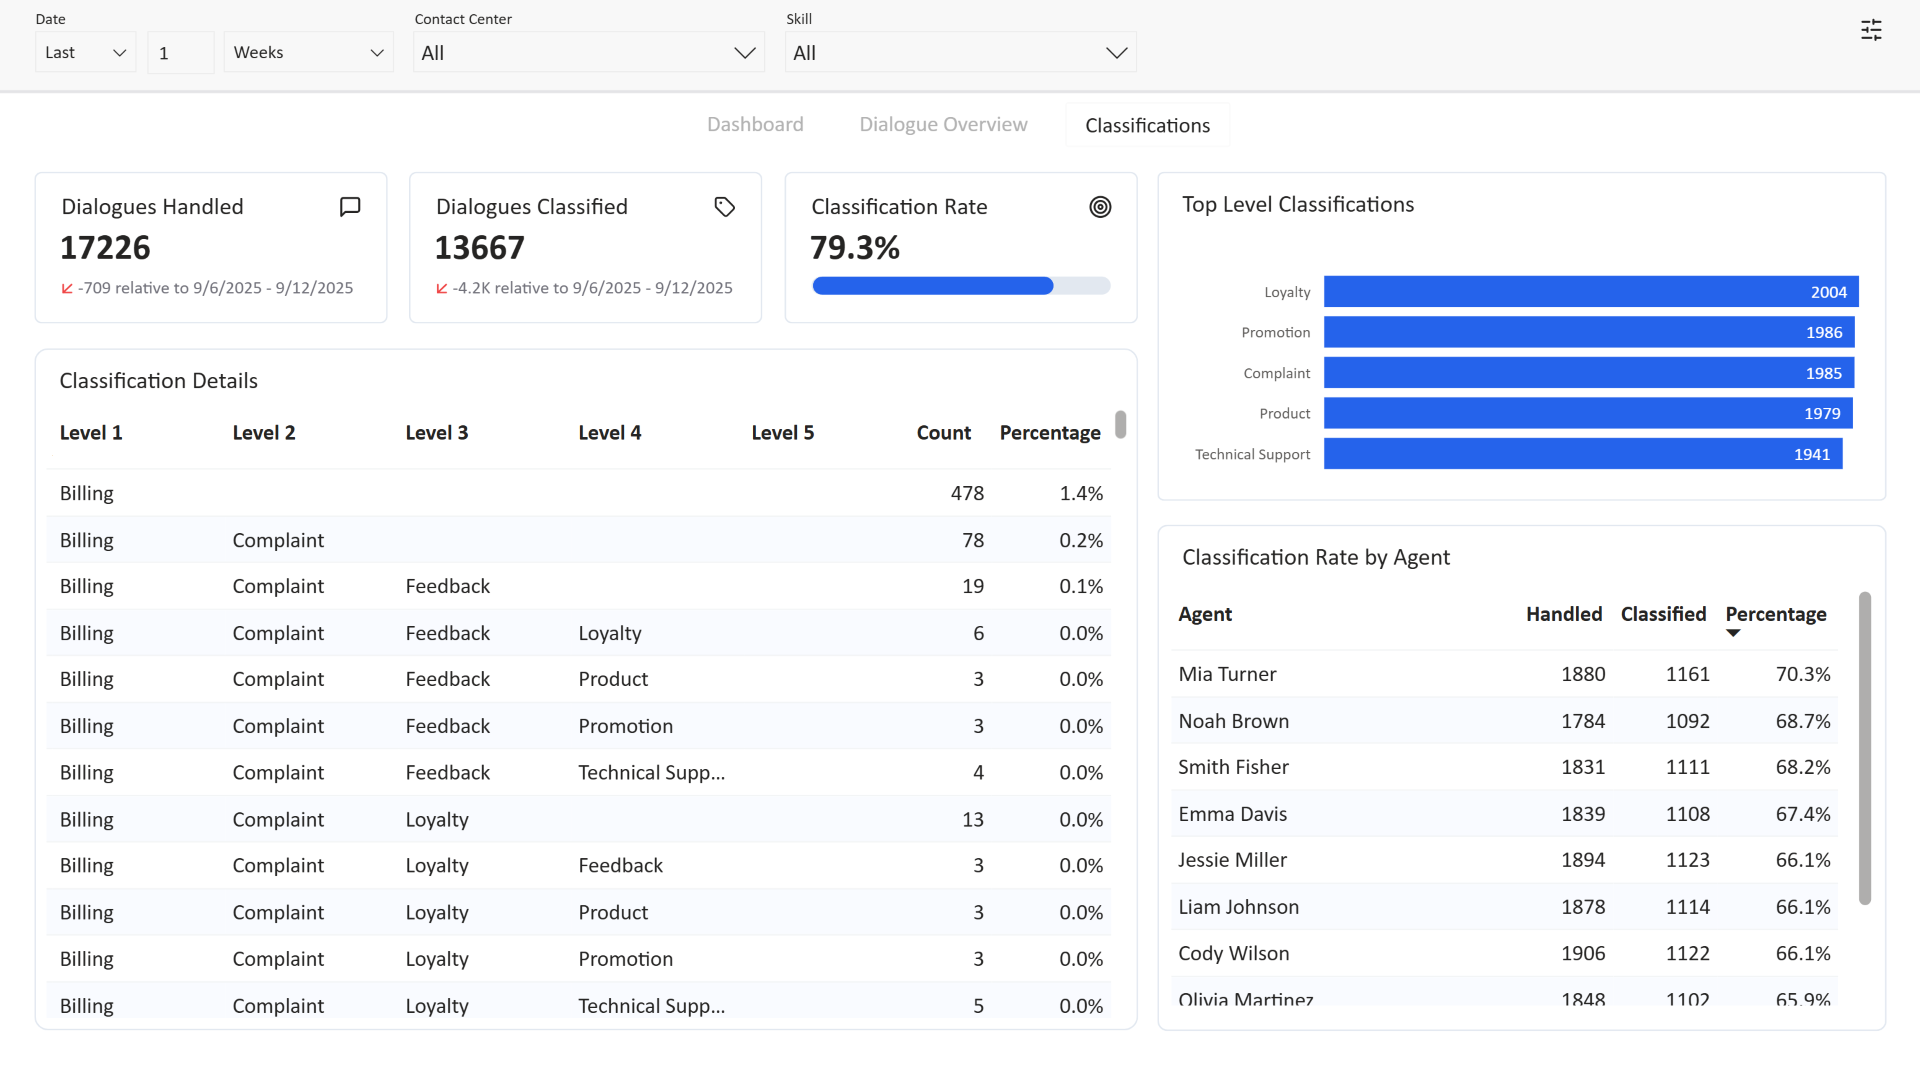
Classification Details
The Classification Details table lists the unique combination of classifications (up to 5 levels) that are assigned to a dialogue, along with the number of dialogues that received this unique combination of classifications together with the percentage represented by these dialogues.

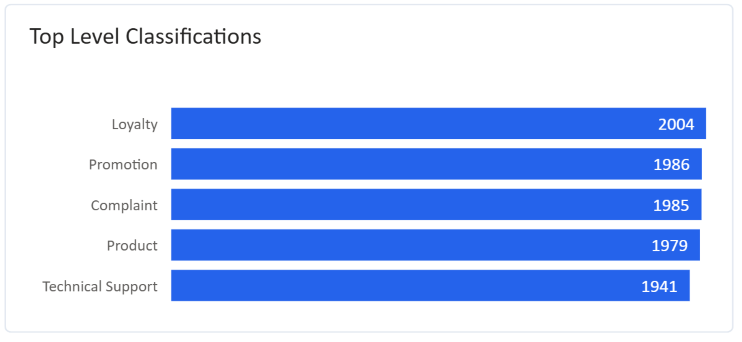
Top Level Classifications
The Top Level Classifications graph displays the classifications of the first level assigned to dialogues, ordered from most assigned to least assigned.
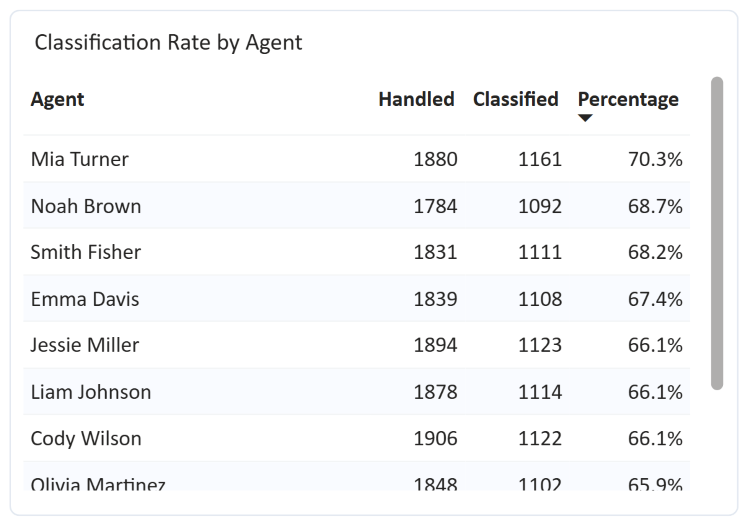
Classification Rate by Agent
The Classification Rate by Agent graph displays the number of dialogues handled by an Agent, the number of dialogues classified by an Agent and the resulting Classification Rate.